[2024/ 5/ 18] The pie charts below show the percentage of coffee productions from different regions,of consumption in different regions and of the profits in different fields in 2014.
【主体段分段】:
一饼一段
【开头段】
The pie chars present information about where coffee was produced and consumed in various places, as well as how the profit was allocated into four aspects for the year 2014.
【概述段】
It is clear that South Africa was the primary producer of coffee, while the major market was in Europe. Also, logistics was the most profitable sector.
思路要点:
- South Africa产量
- Europe消耗量
- delivery利润占比
【Body 1】
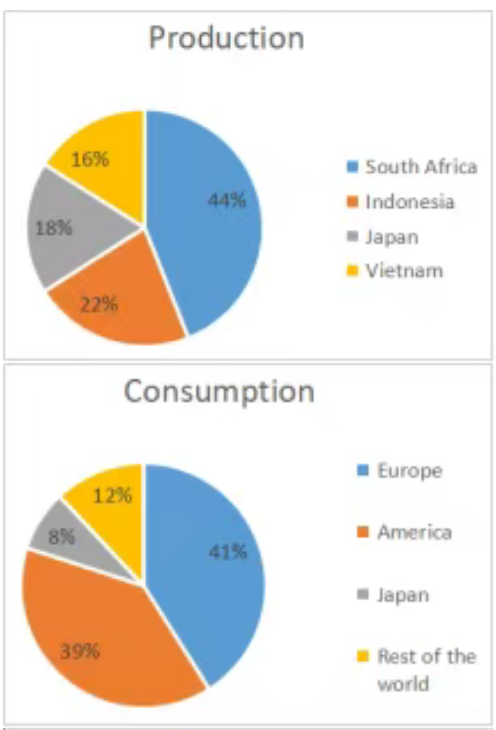
As is shown in the first chart, South Africa took the dominant position in coffee production, with the figure of 44%. By contrast, only 16% of the coffee was produced from Vietnam. Japan and Indonesia shared a similar figure in terms of coffee production, with roughly 20%.
思路要点:production
- South Africa(44%)
- Vietnam(16%)
- Japan 和Indonesia相似(大约20%)
【Body 2】
When it comes to the consumption of coffee, we can see that people in Europe consumed the largest amount of coffee(41%). America came next, with 39% of coffee consumed. The coffee consumed in Japan only accounted for 8% of all the coffee consumption, and the remaining 12% of the coffee was sold in other areas of the world.
思路要点:consumption
- Europe(41%)
- America第二(39%)
- Japan(8%)
- 剩下地区12%
【Body 3】
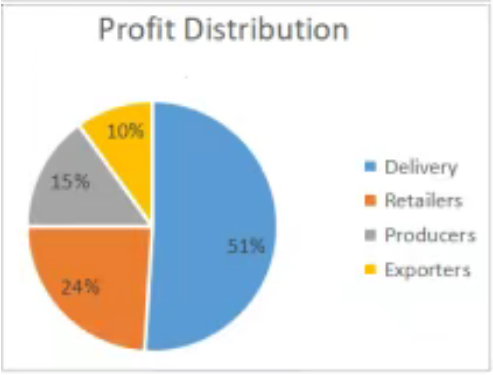
Regarding the composition of profits, it is clear that coffee profit was mainly derived from delivering process(51%), more than twice the figure for retailing. A lower proportion of profits went to producers(15%), 5% higher than the figure for exporters.
思路要点:profit distribution
- delivery(51%),大约是retailers的两倍
- producers较低(15%),比exporters高5%
0元领取剑桥雅思系列真题解析、托福TPO、SAT考试真题,更多独家资料免费领取。