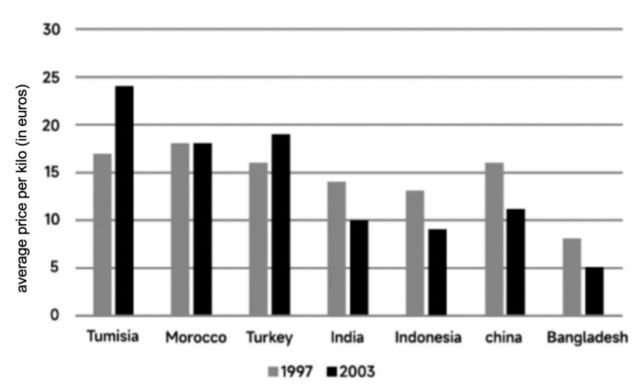
The chart below shows the average price per kilo of clothing imported into the European Union from seven major countries of origin in 1997 and 2003.
【主体段分段】:
按照<趋势>分段
Body 1:后四个国家(下降)
Body 2:前三个国家(上升、平稳)
开头段
The bar chart illustrates changes in clothing prices per kilogram exported by seven different countries to the European Union for the years of 1997 and 2003.
概述段
Overall, people were charged the highest for garments from Tunisia in both years, while they paid the least for clothing from Bangladesh. Also, Morocco was the only country where prices remained unchanged during the period.
思路要点:
- Tunisia两年价格都,Bangladesh两年价格都
- 只有Morocco两年价格不变
Body paragraph 1
It is clear that four countries lowered their prices over the six-year period. India and Indonesia initially charged €13 per kilogram, slightly less than China's €16. Subsequently, prices in these three countries experienced a noticeable drop by €4 in 2003. Bangladesh consistently had the lowest price, with a slight decrease from €8 in 1997 to €5 in 2003.
思路要点:后四个国家(下降)
- 1997年,India、Indonesia价格相似(约为€13),轻微低于China价格(€16)→随后这三个国家价格都显著下降了€4
- Bangladesh 价格一直,从€8轻微下降到€5
Body paragraph 2
The remaining three countries exhibited varying trends. Tunisia experienced a significant rise in clothing prices, from €17 to €24, making it the most expensive choice in both years. In contrast, Morocco charged the same price in both years(€17).
思路要点:前三个国家(上升、平稳)
- Tunisia 价格从€17 显著上升到 €24,两年内价格都
- Morocco两年价格不变(€17)
0元领取剑桥雅思系列真题解析、托福TPO、SAT考试真题,更多独家资料免费领取。