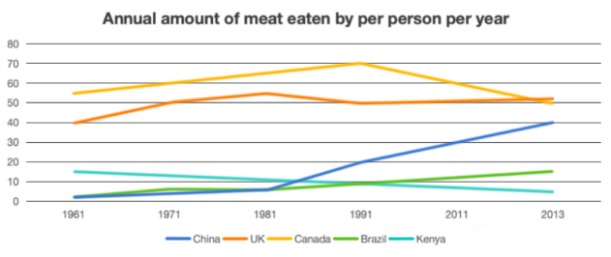
The graph below shows annual amount(kg) of meat eaten by per person per year in five different countries from 1961 to 2013.
分段方法:
方法1:按照<趋势>分段
- Body 1:UK,China,Brazil(整体呈上升趋势)
- Body 2:Canada,Kenya(整体呈下降趋势)
方法2:按照<数值大小>分段——本篇文章采用此种分段方法
- Body 1:Canada,UK(整体数值较高)
- Body 2:China,Brazil,Kenya(整体数值较低)
开头段
The line graph compares the per capita meat consumption (in kilograms per person) in five countries from 1961 to 2013.
概述段
It is clear that Canada and UK consistently consumed more meat than the other three countries throughout the given period. While Canada and Kenya experienced a decline in their meat consumption, the reverse was true for the other countries.
思路要点:Canada、UK
- Canada、UK整体数值较高
- Canada、Kenya数值整体 呈下降趋势,其余三个国家呈上升趋势
Body paragraph 1
In 1961, Canada took the lead with a consumption of 55 kilograms per person. This figure rose steadily, reaching a peak of 70 kilograms in 1991, before falling significantly to roughly 60 kilograms by 2013. The figure in UK followed a similar pattern, increasing noticeably to 55 kilograms in 1981, followed by a slight dip to 50 kilograms in 1991. However, in the next 22 years, this figurerose marginally by 2 kilograms, surpassing Canada’s consumption in 2012.
思路要点:Canada,UK
- Canada:1961年数值所有国家中(55kg)→到1991年显著上升到峰值70kg→到2013年显著下到60kg
- UK:1961年到1981年显著上升达到55kg→1991年小幅度下降到50kg→到2013年轻微上升了2kg,其中在2012年与Canada有交点
Body paragraph 2
By contrast, the figures in the remaining three countries were lower. China had the lowest consumption in 1961(only 2 kilograms). After a slow growth to 5 kilograms in 1981, its consumption soared to 40 kilograms in 2013, making it the third-largest consumer of meat by the end of the period. Likewise, the figure in Brazil, which almost equaled that in China until 1981(5 kilograms), tripled by 2013. Conversely, the given 52-year period witnessed a gradual decline in Kenya’s meat consumption, dropping to just 5 kilograms in 2013.
思路要点:China,Brazil,Kenya
- China,Brazil,Kenya整体数值较低
- China:1961年数值为2kg→到1981年小幅度上升到5kg→到2013年急剧上升到40kg,在这一年China数值排第三
- Brazil:在1981年之前和China数值几乎相等→到2013年上涨了3倍
- Kenya:1961年到2013年持续下降,到2013年为5kg
无锡校区地址:
云蝠校区(语培):
无锡市梁溪区中山路288号云蝠大厦22楼
官方电话:400-6799-120
云蝠校区(留学):
无锡市梁溪区中山路288号云蝠大厦21楼
官方电话:400-6799-120
江阴校区:
江阴市虹桥南路296号301
官方电话:400-6799-120
0元领取剑桥雅思系列真题解析、托福TPO、SAT考试真题,更多独家资料免费领取。