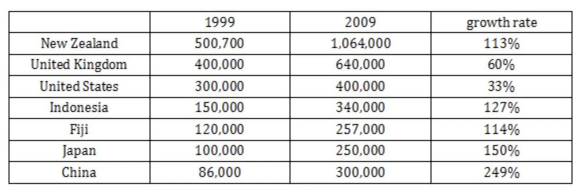
[2024/ 5/ 25] The table shows information about the number of Australian people who visited the seven most popular destinations in 1999 and 2009.
【主体段分段】:
Body 1:New Zealand, UK, US(两年数值较高,但变化幅度小)
Body 2:其余4个国家(两年数值较低,但变化幅度较大)
【开头段】
The table illustrates how many Australian tourists paid a visit to seven most attractive countries for the years of 1999 and 2009.
【概述段】
It is clear that the popularity of all the seven destinations increased in the given period. This is especially true for China since it saw the most dramatic growth.
思路要点:
- 去七个国家的游客数量都增多
- 去China的游客数量涨幅
【Body 1】
We can see that in the initial year, New Zealand took the lead in the number of Australian tourists, with the figure of 500,700. UK and US came next, with 400,000 and 300,000 Australian people making the trip. After 10 years, arrivals to New Zealand still ranked the top, rising significantly by 113%. A less remarkable growth by 60% and 33% was found in the other top two popular destinations.
思路要点:
New Zealand, UK, US
1. 1999年:New Zealand数值(500,700),UK第二(400,000),US第三(300,000)
2. 2009年:
(1) New Zealand数值依然,显著上升了113%
(2) 其余2个国家:上升幅度略小(涨幅分别为60%和33%)
【Body 2】
By contrast, fewer Australians chose to visit Indonesia, Fiji, Japan and China in both years, but these four countries witnessed a more noticeable climb in their popularity. To be more specific, China only attracted 86,000 travelers from Australia in 1999, half the figure for Indonesia. Subsequently, these two figures was on a dramatic increase, rising by 249% and 127% respectively. Besides, roughly 110,000 surveyed Australians visited Fiji and Japan in the first year, and this figure more than doubled after a decade.
思路要点:Indonesia, Fiji, Japan, China
- 其余四个国家数据较小,但涨幅较大
- China1999年数据为86,000,大约为Indonesia的一半;2009年两者数据分别急剧上升了249%和127%
- Fiji和Japan在1999年数据相似(大约110,000)→随后翻倍
0元领取剑桥雅思系列真题解析、托福TPO、SAT考试真题,更多独家资料免费领取。