The chart below gives information on the numbers of workers (in every thousand workers) in different occupations who migrated to Australia between 2009 and 2012.
分段方法:
Body1: Accountant, Computer Programmer
Body 2: Cook、Soft engineer
开头段
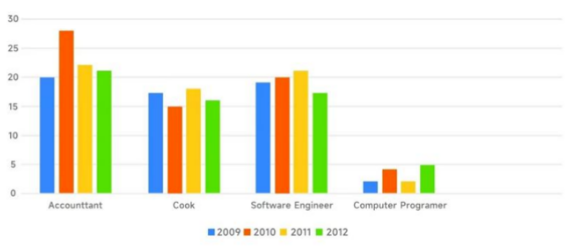
The bar chart compares four occupations (accountants, computer programmers, cooks, and software engineers) with regard to the number of migrant workers moving to Australia from 2009 to 2012.
概述段
Overall, compared with other workers, more accountants immigrated to Australia, experiencing the most significant rise in numbers. In contrast, computer programmers were the least common group of immigrants.
思路要点:
- Accountant数据一直zui高,涨幅也zui大
- Computer programmer数据一直zui低
Body paragraph 1
Looking at details, we can f i n d that accountants took the lead in terms of migrant numbers, starting at 20,000 in 2009. This figure saw a sharp increase to the peak at 28,000 in 2010, before declining to 21,000 by 2012. By contrast, Australia was much less favored by computer programmers, with the number fluctuating between 3,000 and 5,000 during the given period.
思路要点:
Accountant、Computer Programmer
- Accountant年数据zui高(20,000)→2010年急剧上升到峰值28,000→2012年显著下降到21,000
- Computer Programmer:数据一直zui低,在3,000到5,000范围内波动
Body paragraph 2
Similar figures could be found if we compare the numbers of cooks and software engineers moving to Australia. In 2009, 18,000 software engineers migrated to Australia, making them the second-largest group, just ahead of cooks, who numbered 17,000. After 2 years, the former figure grew marginally to 21,000, after which there was a remarkable fall to the lowest point at 17,000 in 2012. Conversely, the number of cooks remained relatively stable, ranging from 15,000 to 17,000 over the four years.
思路要点:Cook,Soft Engineer
- Cook和Soft Engineer整体数据较为相似
- soft engineer年数据排第二(8,000), cook排第三(17,000)
- 2011年soft engineer数据小幅上升到21,000→到2012年显著下降到17,000
- cook在这个时间段数据 在15,000到17,000范围内 轻微波动
0元领取剑桥雅思系列真题解析、托福TPO、SAT考试真题,更多独家资料免费领取。