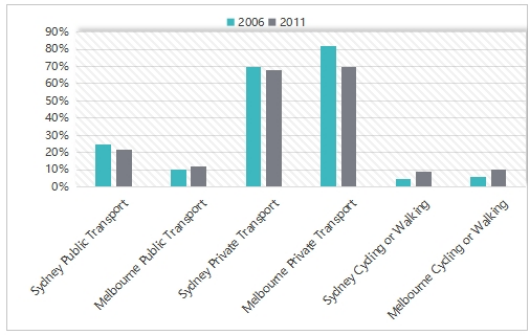
The bar chart below shows percentages of people choosing different ways to go to work in two cities in 2006 and 2011.
主体段分段:按照<数值大小>分段
- Body 1:private transport、cycling or walking
- Body 2:public transport
开头段
The bar chart compares Sydney and Melbourne in terms of the proportion of commuters using three different modes of transport (private transport, public transport, and cycling or walking) in 2006 and 2011.
概述段
Overall, private transport was the dominant choice for commuters in these two cities during the given period,while cycling or walking remained the least favored option. Additionally, public transport was the only mode whose usage trends differed between the two cities.
思路要点:
- 两个城市两年都是private transport数值,cycling or walking 数值
- 两个城市只在public transport的使用率呈现相反趋势
Body paragraph 1
In 2006, the majority of commuters relied on private transport, with 81% of people in Melbourne and 70% in Sydney using this mode. Over the next five years, the proportion of private transport users in Melbourne dropped significantly to 70%, while Sydney saw a minor decline of just 1%. In contrast, cycling or walking was chosen by only 4% of commuters in both cities in 2006, although this figure more than doubled to 10% by 2011.
思路要点:
- private transport:2006年两地数值都(Melbourne为81%,Sydney为70%);2011年,Melbourne急剧下降到70%,Sydney轻微下降了1%
- cycling or walking:2006年两地数据都为4%,2011年上涨两倍多达到10%
Body paragraph 2
When it comes to public transport usage, these two cities displayed contrasting trends. In Sydney, the proportion of commuters choosing this way declined slightly from 25% in 2006 to 22% in 2011. However, Melbourne's reliance on public transport remained much lower, climbing marginally by just 1 percentage, from 10% to 11% over the same period.
思路要点:
- public transport:两个城市趋势相反
- Sydney:2006年的25%→小幅下降到2011的22%
- Melbourne:数据较低,2006年为10%,轻微上升到2011年的11%
无锡校区地址:
云蝠校区(语培):
无锡市梁溪区中山路288号云蝠大厦22楼
官方电话:400-6799-120
云蝠校区(留学):
无锡市梁溪区中山路288号云蝠大厦21楼
官方电话:400-6799-120
江阴校区:
江阴市虹桥南路296号301
官方电话:400-6799-120
0元领取剑桥雅思系列真题解析、托福TPO、SAT考试真题,更多独家资料免费领取。