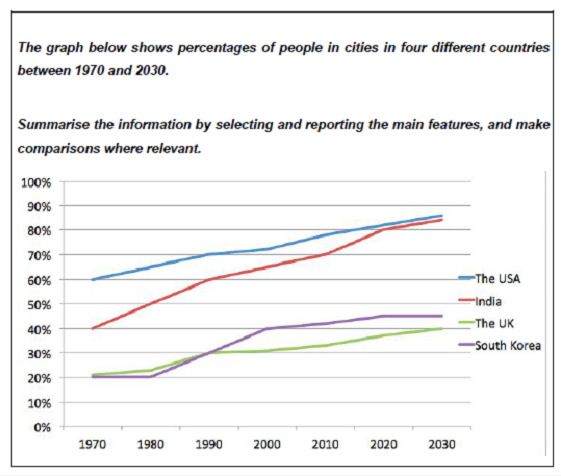
数据图:线图
主要描述变化
可能描述比较
时间:从过去到将来

注意:图中的时间轴是从过去到将来,强烈提醒对于“现在完成时”的使用。
# Introduction
第 一句话说明图的大意:In the graph are four lines that respectively depict four country’s urban population counted in percentage terms since 1970 and the projected percentages till 2030.
划线的部分是倒装现象,然后对four lines进行定语从句修饰,可以干脆背下来当套话用(这里的倒装的实用目的是让four lines在主句的最后面从而方便承接后面的长度可观的定语从句)。可不可以在开头段落里没有对于图的总述?可以。但是,那就必须要有结尾段落去对图的宏观特点进行陈述。
# Body
In 1970, the respective numbers, in descending order, were America’s 60%, India’s 40% and 20% in both the UK and South Korea. Since then, there has been apparent growth in all the four countries.
第 一句“罗列法”是个快速省劲的办法,尤其适合老章的思路:先把四个起点介绍了,毕竟起点数值是重要信息。这也可以为接下来正好用“现在完成时”创造语境。
India, with the percentage ascending by 30 points, and South Korea, whose percentage has increased twofold, have seen the most marked growth. By contrast, America’s 20% increase and the UK’s 15% increase are comparatively moderate. Other three things during the years are also notable: first, South Korea has taken the UK’s initial third place since 1990; second, India has been approaching the US; third, however fast India’s growth has been, the leading country has always been the US.
第 一句话写印度和韩国,因为这两个国家的增长更显著。并且一句话了事。尤其注意:India那里的状语修饰,和South Korea那里的定语修饰 第二句话写美国和英国。句子之间用by contrast建立联系,那么就兼顾了【变化】和【比较】。老章的这个写法是很妙的,彻底摆脱了线形的束缚和思维定式。第三句话的写法其实不难,就是学会冒号的用法(前一句以冒号结尾,那么冒号后的内容就是去讲前一句的具体情况)和分号的用法(关系密切的三个分句放在同一个句子里)。这是老章惯用的句法。每个分句都很简单,但是句子就是不停,把读者的注意力控住。同时要注意第三个分句时,句子主语变了(不就是主语和表语颠倒一下嘛),以及however在句中的意思是“不管怎样”。总之,这一段的学习点包括:写作内容取舍;信息的组织方式;黄色高亮部分的形容词、动词、副词;语法现象和句型。
In the future, except in South Korea, greater portions of urban dwellers are expected in those countries by 2030, whereas the current rankings may not change.
这一段注意:1、对于预测得出的信息,动词不要带有肯定语气。2、by+时间,意思是“到什么时候”。3、黄色高亮的词汇肯定要学会。4、用except时,要注意逻辑一致。
# Conclusion
Overall, although the growth has been universal in those countries, it has shown pattens that vary.
因为开头段落没有对于图的总述,那么,必须要有结尾段落,去对图的宏观特点进行陈述。
0元领取剑桥雅思系列真题解析、托福TPO、SAT考试真题,更多独家资料免费领取。
