* 数据图:【饼图】
* 主要描述:【比较】。注意:比较关系存在于每个饼内部的板块,也存在于饼之间。

# Introduction
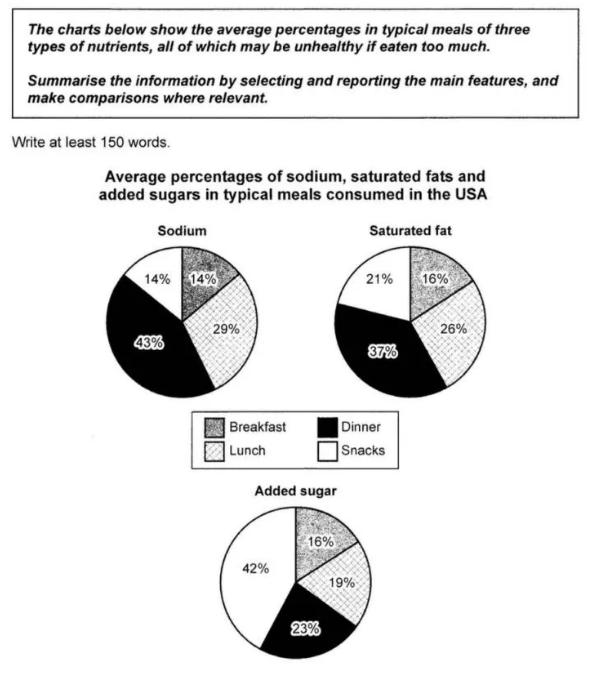
Shown in the set of three pies are the average percentages of three substances consumed in Americans’ meals. in general, there are apparent similarities and notable differences.
* 开头段落中的第 一句话的划线部分是老章反复提及的倒装现象。
* 开头段落中的第二句话,既是对图表的总述,也是套话,还有词汇得分点(表示程度的形容词)。
# Body
老章强烈建议,在展开主体部分的写作之前,对图表中的信息进行分组:找到异同。一般说来,相同或相似在一组。然后,去对比于不同的一组。
First, the similarity between the intake of sodium and that of saturated fat is marked: in dinner, American people take in the largest portion (43% and 37% respectively) of a day’s whole amount of the two nutrients they consume. The second highest daily intake of sodium (29%) happens in lunch and is twice of the intake when Americans eat breakfast or snacks. Third, in terms of the consumption of saturated fat, there are no wide variations but a 5% difference between the meals except dinner.
The case with added sugar is vastly different. 42% – a predominating percentage – of added sugar is taken in during eating snacks, making a sharp contrast with the 16%-23% during the three regular meals.
* 最后这个段落,两句话。第 一句话是用第三个饼去比较于前两个饼。第二句话是第三个饼内部的比较。
# Conclusion
Overall, since those substances may cause health problems if eaten in excessive amounts, Americans should be most careful when they eat dinner and snacks.
* 这个结尾段落的写作内容有一些难度。难点在于超越了数字,去解读数据暗示的信息(但是注意,这个解读是安全的,是基于题目中的“all of which may be unhealthy if eaten too much”而来的)。
0元领取剑桥雅思系列真题解析、托福TPO、SAT考试真题,更多独家资料免费领取。
