【图表形式:表格】
考核点:1. 对比不同时间,数值前后的变化; 2. 同一时间(年份),数值大小比较(突出最值)
首段:概述表格大致内容—对比不同时间段(前后两个年份-2000 VS 1985),前后数值的变化。
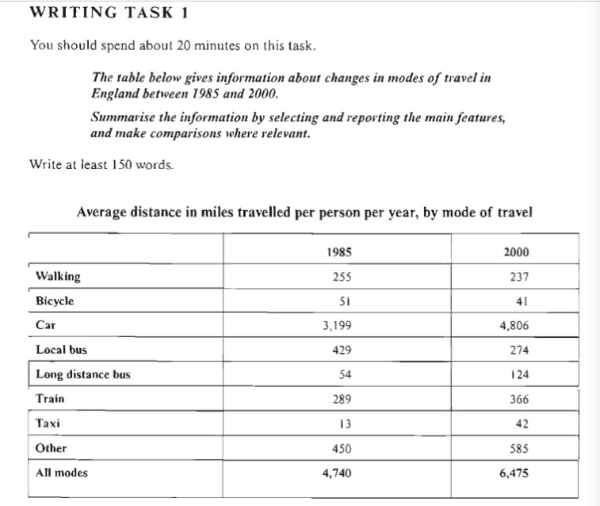
The table illustrates how different modes of travel changed in England in two different years: 1985 and 2000.
主体段1: 数值增加组(car, other, train, long distance bus, taxi), 依次对比各项的数值增长幅度。
Car, the most prevalent means of transport, 【同位语,解释说明作用,此处概括出car的特征,两个年份(1985和2000)中的值】was the most noticeable, as the average distance by this mode per person per year showed a marked increment of around 1,600 miles in 2000 compared with that in 1985. 【原因状语从句:as + …】Similarly, there was a moderate growth in the distance covered by other mode of transport in 2000 when the figure reached 585 miles. 【定语从句】Meanwhile, slight rises could also be observed in the average distance of trips by taxi, long distance bus and train, all of which grew by fewer than 100 miles. 【定语从句】
词汇使用:
prevalent:adj. 普遍的
increment:n. 增加
cover:v. 走过(distance)
主体段 2: 数值减少组(local bus, walking, bicycle), 在该段中同样地细化各项的变化(减少)幅度。
The remaining modes of transport, on the other hand, experienced several drops in terms of the average distance. More precisely, dramatic shrinkage could be found in people’s preference for taking local bus, with the figure declining steeply from 429 miles to 274 miles. 【独立主格结构】 Also, the year of 2000 witnessed marginal decreases in the numbers of walkers and cyclists.
词汇使用:
shrinkage:n. 减少
steeply:adv. 急剧地
marginal:adj. 微小的
walkers and cyclists: 词汇替换,分别对应表格中“walking”和“bicycle”,词汇使用背后的含义是“这两种出行方式里程数的减少,说明选取两者的人数缩减”。
结尾:总结—各类型的变化差异(明显)+ 数值总量变化(增加)
Overall,people’s preference for various modes of transport varied enormously from 1985 to 2000, and the overall distance showed a remarkable rise.
0元领取剑桥雅思系列真题解析、托福TPO、SAT考试真题,更多独家资料免费领取。
