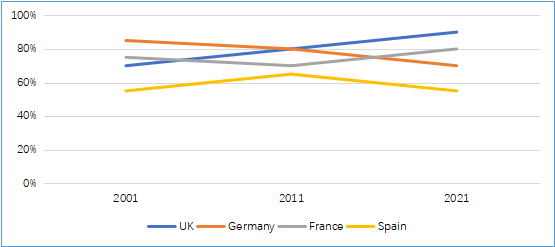
线图(数据型图表)2022.10.22真题 四国医疗服务满意度
The graph below shows the level of satisfaction for health care in four countries in three different years.

【首段: 简要陈述线图的核心内容—“连续时间”的变化情况】
The lines illustrate how individuals’ satisfaction with health care changed in the UK, Germany, France and Spain over a period of 2001 to 2021.
【主体段1:UK & France—变化相近,同为满意度攀升】
A common situation was observed in the UK and France, as people became increasingly satisfied with the healthcare condition. One soared constantly from 70% to 90%, taking the lead by 2021, while the other continued to rise after a 5-percent marginal drop between 2001 and 2011.
[主体段内容按照“总-分”结构展开]
注意:“程度修饰词”和“变化类动词”的使用
【主体段2:Spain & Germany—变化差异大】
By stark contrast, there was a disparity between the two remainders. Most notably, with the percentage staying at below 65%, Spain witnessed the lowest level of content in the given period. This contrasted sharply with the change in the figure for Germany, a consistent and moderate drop from 85% to 70%. It is also worth mentioning that the level of Germany fell under that of the UK after 2011 and that of France after 2016, despite the leading position it had in 2001.
写作内容小结:
1. 段落之间的衔接
2. 词汇:Disparity n. 悬殊的差异
3. 程度修饰词的使用(adj. & adv.)
4.使 用同位语
【结尾】
To sum up, healthcare received the worst evaluation in Spain, while the evaluation in the three remainders varied from year to year.
0元领取剑桥雅思系列真题解析、托福TPO、SAT考试真题,更多独家资料免费领取。
