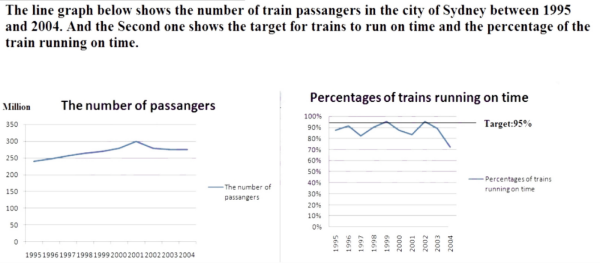
The line graph below shows the number of train passengers in the city of Sydney between 1995 and 2004. And the second one shows the target for trains to run on time and the percentage of the train running on time.

【图表类型】线图组合;2015.06.27旧题翻新
【考核点】:数值变化
Depicted in the line graphs are the changing number of passengers travelling by train in Sydney and the changes in the punctuality rate of this mode of transport. The period of 1995 to 2004 is investigated.
倒装结构
be动词使用(主谓一致)
核心词汇替换【punctuality n. 准时,守时】
As is shown in the first graph, the number of passengers going by train was within a narrow range of around 250 million to 300 million. To specify, there was a marginal 50-million growth between 1995 and 2001 before a moderate decline was found until 2004.
段落结构——总-分【笼统-具体】
程度修饰词的使用
More noticeable changes occurred in the performance of trains arriving on time. Starting from nearly 90%, the proportion of trains which arrived on time jumped to the peak at higher than 95% in both 1999 and 2002, the targeted level at which the trains were expected to achieve, before plummeting to approximately 70%, the all-time low throughout the given period.
段落结构——总-分【笼统-具体】
程度修饰词的使用
动词的现在分词(作状语)
同位语成分(其中包含定语从句)
To sum up, the increase in the number of train passengers was the general trend, while the problem of delayed trains became worse than ever before.
0元领取剑桥雅思系列真题解析、托福TPO、SAT考试真题,更多独家资料免费领取。
