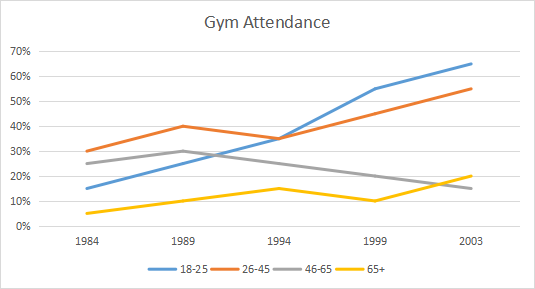
The graph shows the percentage of people visiting the gym once a month or more between 1984 and 2003.

类型:动态图——折线图
写作注意点:复杂趋势的描述
The line graph illustrates the proportion of people who went to gyms on a monthly basis from 1984 to 2003.
【开头段:概括图表主要内容。通过同义替换改写题目。】
Overall, people from 18 to 45 years old were generally more interested in going there, while the reverse was true for elder people over 65.
【总结段:也可写在结尾。总结图表中的总体突出特征。】
An obvious upward trend can be observed in the proportion of visitors aged under 45. In 1984, 30% of people aged 26 to 45 worked out in gyms every month, ranking the first among all the age groups. Despite some fluctuations, from 1994, the figure kept rising substantially from 35% to 55% in 2003. Apart from that, people in their early adulthood showed mounting interest in this activity, since the figure ballooned beyond all recognition from 15% to 65%, surpassing that of the aforementioned group in 1994.
【主体段1:描述18-25岁和26-45岁的趋势和对比。注意描述多条折线时,句式的多样性。】
A different situation can be found in elder people over 45 years old. Although there was a marginal increase in the percentage of people aged 46 to 65 during the first 5 years, the figure later experienced a steady decline from 30% to 15%, trailing the data of all the other age groups in 2003. Such sports facilities were actually not popular among senior citizens above 65 years old, with only less than one-fifth of them going there throughout the 20 years. In spite of some recorded peaks and troughs, the proportion finally reached 20% in 2003.
【主体段2:描述46-65岁和65岁以上的趋势并互相对比。】
0元领取剑桥雅思系列真题解析、托福TPO、SAT考试真题,更多独家资料免费领取。
