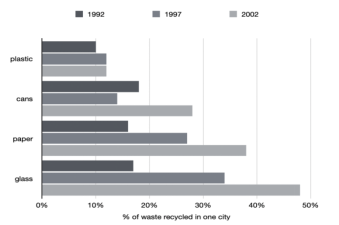
[2023.5.20] The chart below shows the percentage of different types of household waste that were recycled in one city between 1992 and 2002.

【主体段思路分析】
分段方法1:按照主体对象分段(本篇文章采用此种他分段方法)
- glass+paper一段
- plastic+cans一段
分段方法2:按照时间分段
【开头段】
The bar chart illustrates changes in the figures for four categories of domestic waste recycled in a city from 1992 to 2002.
【概述段】
Overall, there were improvements in the recycling of all the four types of waste. Most noticeably, the greatest change could be found in the proportion of recycled glass.
语言点提示:生活化表达
【Body 1】
Looking at the information in more detail, we can see that in the initial year, only about 15% of glass was recycled. After 5 years, this figure more than doubled, followed by a remarkable growth to 48% in 2002. During the same period, the percentage of recycled paper also witnessed a constant climb, rising significantly from about 14% in 1992 to 38% in 2002.
思路要点:
- glass:急剧上升→小幅度上升
- paper:显著上升
【Body 2】
It is clear that the figures for the other two kinds of waste were relatively lower in the 10-year period. Although the percentage of recycled cans ranked the top(18%) in the beginning, there was a slight fall in it by 3% in the subsequent 5 years, before rising markedly to 28% by the end of the period. By contrast, the figure for recycled plastic rose marginally to approximately 12% in 1997, after which the last 5 years saw a period of steadiness.
思路要点:
- 其余2种数值较低
- cans:年,随后小幅度下降→显著上升
- plastic:小幅度上升→保持平稳
0元领取剑桥雅思系列真题解析、托福TPO、SAT考试真题,更多独家资料免费领取。
