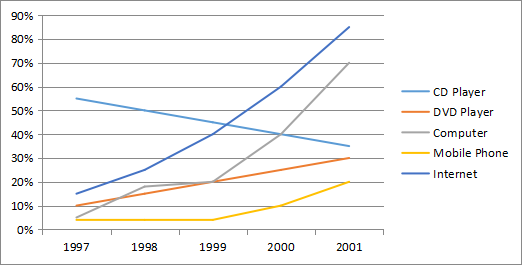
[2023.6.17] The line graph below shows percentages of families using different kinds of technologies in the UK from 1997 to 2001.

【主体段分段】:按照趋势分段
- Body 1:CD player + DVD Player + Mobile phone
- Body 2:Internet + Computer
【开头段】
The line graph illustrates changes in the use of CD players, DVD players, computers, mobile phones and the internet in British households between 1997 and 2001.
【概述段】
Overall, CD player was the only type of technology that saw a downward trend in its usage. Mobile phone appeared to be the least common device in the given period.
**语言点提示:生活化表达
思路要点:
- 只有CD Player比例下降
- Mobile phone比例始终
【Body 1】
Looking at the information in more detail, we can see that the proportion of families having CD players was on a remarkable decline, falling from 55% in 1997 to 35% in 2001. By contrast, although only 10% of the surveyed households owned DVD players in the initial year, this figure tripled by the end of the given period. Likewise, a similar trend could be found in the usage of mobile phones. In the first 2 years, cell phones were only used by 5% of families, after which there emerged a significant growth in this figure by 15% in 2001.
思路要点:
- CD player:显著下降
- DVD player:上涨3倍
- Mobile phone:平稳→显著上升
【Body 2】
It is also clear that the usage of the internet soared from merely 15% to more than 85% in the given 4-year period, overtaking the figure for CD players in 1999. After that, it became the most accessible technology. Similarly, the percentage of access to computers climbed drastically to approximately 18% in 1998, before ascending marginally by 2% in the following year. Afterwards, the final 2 years underwent a boom to 70% in this figure, exceeding the accessibility of CD players in 2000.
**语言点提示:
- 生活化表达
- “交点”描述
思路要点:
- internet:剧增,于1999年超过CD player,成为使用最普遍的科技类型
- computer:急剧上升→轻微上升→剧增,并于2000年超过CD player
0元领取剑桥雅思系列真题解析、托福TPO、SAT考试真题,更多独家资料免费领取。
