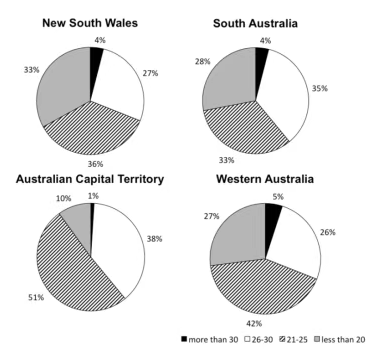
The pie charts show the class size in primary(elementary)schools in four states in Australia in 2010.
【主体段分段】:
Body 1:New South Wales、Western Australia
Body 2:South Australia、 Australian Capital Territory
【开头段】
The pie charts compare the number of schoolchildren in elementary schools of four states in Australia for the year 2010.
【概述段】
It is clear that in all the four states, there were between 21 and 30 students in most of the classes. However, a class with over 30 students was the least common.
思路要点:
- 四个地区中 大部分班级人数在21-30
- 四个地区中 >30的班级占比最小
【Body 1】
The distribution of class sizes was similar in New South Wales and Western Australia. Clearly, a class with 21-25 students accounted for the largest share in these two states(36% and 42% respectively), followed by the figures for classes having fewer than 20 students(33% and 27% separately). By contrast, only no more than 5% of the classes had over 30 students. The rest classes were divided with 26-30 students.
思路要点:
New South Wales、 Western Australia
- 规律相似- 班级人数为21-25:在两个地区都占比(分别占比36%和42%)
- 班级人数<20:排第二(分别占比33%和27%)
- 剩下班级有26-30人
【Body 2】
A different pattern of class sizes could be found in the other two states. Specifically, roughly half of the classes in Australian Capital Territory were comprised of 21-25 students, in contrast to the proportion of classes having 26 to 30 students(38%). Classes with under 20 students occupied 10% in this state, 9% higher than the figure for classes having over 30 students. Likewise, in South Australia, classes with the largest number of students also took up the smallest percentage(4%). The other three types of classes shared a similar figure, at roughly 30%.
思路要点:Australian Capital Territory、South Australia
- Australian Capital Territory:
21-25人的班级大约一半,26-30人的班级占38%
<20的班级占10%,比>30人的班级多9%
- South Australia:
人数最多的班级占比也最少(4%);
其余三种班级数据相似(大约30%)
0元领取剑桥雅思系列真题解析、托福TPO、SAT考试真题,更多独家资料免费领取。